
Calgary Real Estate Market Update: Jan 2023
December sales eased, however, slowing sales over the second half of 2022 were not enough to offset earlier gains as sales reached a record high of 29,672 units in 2022.
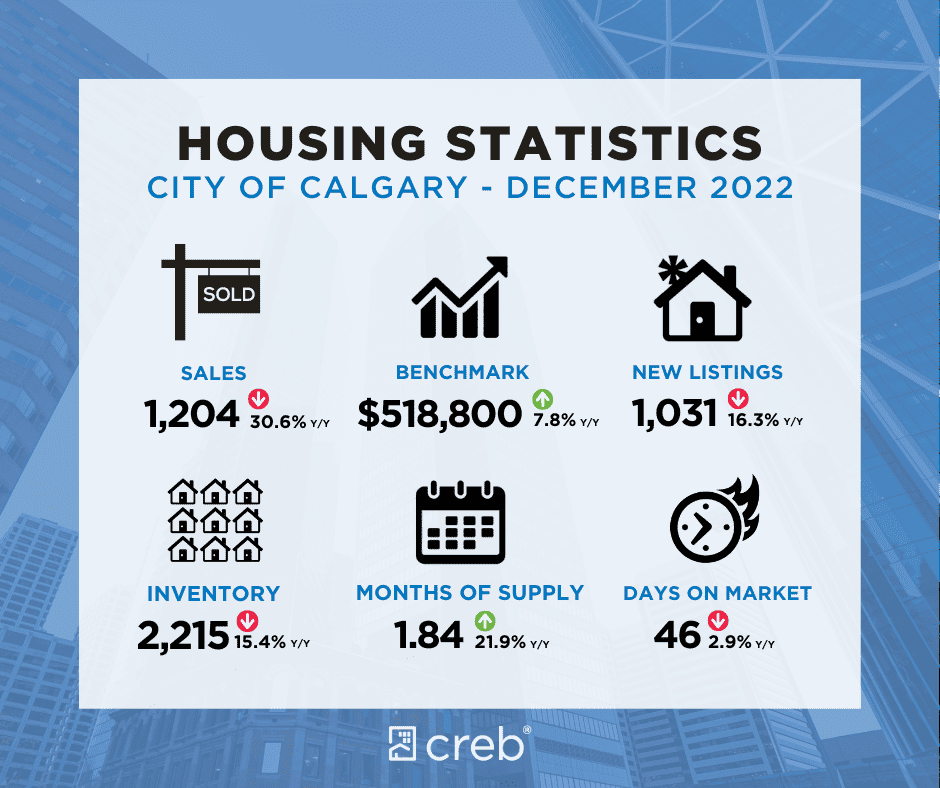
Over the past several months, the pullback in sales was also met with a significant pullback in new listings, causing further declines in inventory levels. As of December, there were 2,214 units available in Inventory, making it the lowest level of inventory reported for December in over a decade.
“Housing market conditions have changed significantly throughout the year, as sales activity slowed following steep rate gains throughout the later part of the year,” said CREB® Chief Economist Ann-Marie Lurie. “However, Calgary continues to report activity that is better than levels seen before the pandemic and higher than long-term trends for the city. At the same time, we have faced persistently low inventory levels, which have prevented a more significant adjustment in home prices this year.”
Benchmark prices eased to $518,800 in December, down nearly five percent from the peak price in May but almost eight percent higher than last December. While prices have trended down annually, they remain over 12 percent higher than last year’s levels.
The housing market in 2022 generally outperformed expectations both in terms of sales and price growth.
Detached Homes
The detached market has felt most of the impact of higher rates as a pullback in sales in the year’s second half contributed to the year-to-date decline of over seven percent. While there have been some gains in new listings over the last quarter, much of the growth has occurred in the market’s upper-end, supporting more balanced conditions. However, supply levels for lower-priced homes remain low relative to the sales activity, causing that market segment to continue favouring the seller. Overall, the detached market has seen activity shift away from the strong sellers’ conditions reported earlier in the year.
Prices in the detached market have trended down in the second half of the year, as the December benchmark price of $619,600 has eased by just over four percent from the June high. The recent adjustments have not erased all the earlier gains, as benchmark prices reported an annual gain of over 14 percent. Annual price growth has ranged from a high of 19 percent in the South East, North and North East districts to a low of nearly eight percent in the City Centre.
Semi-Detached Homes
Further declines in sales this month contributed to the year-to-date sales decline of nearly three percent. While sales have eased relative to last year’s record levels, activity is still far stronger than long-term trends and levels reported prior to the pandemic. At the same time, new listings have been trending down for this property type, keeping the inventory and months of supply relatively low compared to historical levels.
While conditions are not as tight as earlier in the year, there has been some downward pressure on prices. The monthly benchmark price peaked in May of this year and has eased by nearly four percent since then. However, on an annual basis, benchmark prices remain nearly 12 percent higher than in 2021. The North district reported a higher annual price gain of over 18 percent.
Row Homes
Significant reductions in new listings weighed on sales over the last few months of the year. Despite recent shifts, annual sales in the city reached a new record high, with 5,153 sales in 2022. Not only was it a record year, but sales were nearly double long-term trends. Higher lending rates are driving more purchasers toward the more affordable row options. While new listings were still higher than last year’s levels on an annual basis, the recent pullback combined with relatively strong sales has caused inventory levels to fall.
As of December, inventory levels were at the lowest since 2013. This has ensured that this segment of the market continues to favour the seller. While prices have eased by just over one percent from the June peak, overall year-to-date prices are nearly 15 percent higher than last year.
Apartments
Unlike other property types, apartment condominium sales continue to rise above the previous year’s levels throughout the year. This caused year-to-date sales to rise by 50 percent to 6,221 units, a new record high. Demand for affordable product, along with renewed investor interest thanks to rental rate growth, helped support sales growth. Gains in this sector were also possible thanks to the growth in annual new listings. However, like other sectors, the increase in new listings was not enough to outweigh the sales growth, and inventory levels trended down to levels not seen since 2013.
After several years of being oversupplied, the shift to tighter conditions supported annual price gains of nearly nine percent. While price gains occurred across every district, city-wide prices remain well below the previous highs reached back in 2014.
Erick's Perspective; Jan-Mar 2023 Outlook
As we enter a new year there is a general sense of uncertainty regarding Calgary’s real estate market. On the one hand, Calgarians like all Canadians, are grappling with high inflation + interest rates and are concerned about affordability. On the other hand, Calgary is enjoying strong migration trends while at the same time experiencing record low housing inventory.
It is hard to recall another time in Calgary’s history when there were so many economic disruptions occurring all at the exact same time. To simplify things, I have created a supply and demand index chart for Calgary, it tracks four key zones; North, West, Inner West and Southeast. I have split these zones further into to groups, 600K+ and Sub 600K. This is done to clarify the affordability split. Typical incomes in Calgary have historically been able to afford a home that costs 600K or less, while above average incomes have been able to afford a home 600K+. This index excluded condominiums.
A number 1.00 on the demand curve represents full demand i.e 10 homes are listed in a month and all 10 sell in that month with zero carry over, while a reading of 0.50 represents that 50% of all homes listed were successfully sold in that month and 50% carried over to the next month.
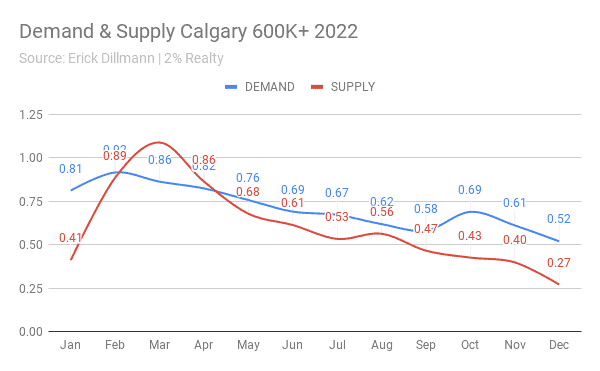
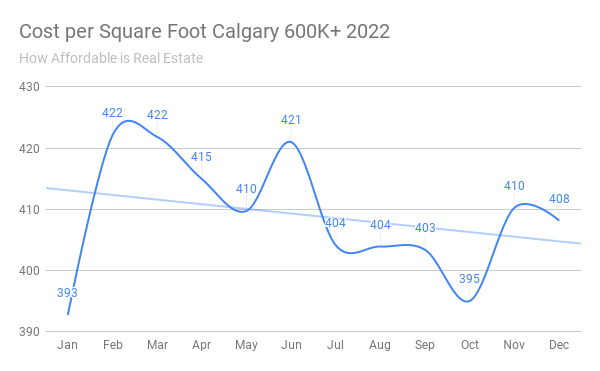
Supply and Demand for 600K+ Homes
From the euphoric start we witnessed in Jan-Mar 2022, we have seen a gradual decline in demand and supply across all four real estate zones.
At the end of December 2022, demand is at 0.52 (meaning only half of homes listed sold) while supply has dropped to the lowest point on record for the index we track.
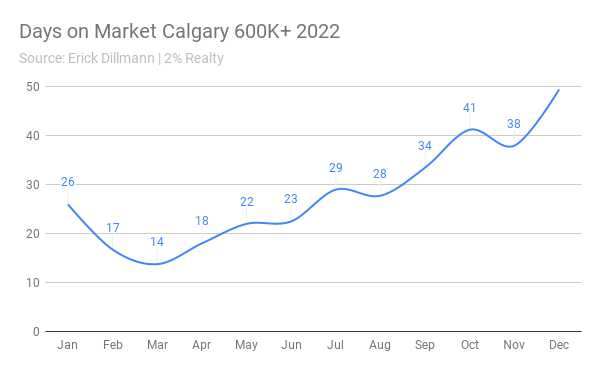
We also see a strong up trend in days on market, which is indicative that demand is falling at a faster rate than supply. This is slightly higher than the seasonal norms and this should translate to slightly lower prices to the point that the market is more balanced.
Homes listed above 600K became less affordable in 2022, costing $393 per square foot at the start of the year and ending at $408 per square foot. However after the initial spike, the cost did trend down for the majority of 2022.
Considerations
We should see a seasonal spike in inventory from Jan-Mar 2023. I would expect a raise in demand back to 0.60, and a drop in the days on market, perhaps to 30 days or less. This should make for an “okay” spring, however I am concerned that even with such low supply, we are still seeing price pressure for homes listed above 600k.
An economic slowdown at some point in the second half of 2023 could cause an inventory spike, and subsequently impact prices in a more sever way.
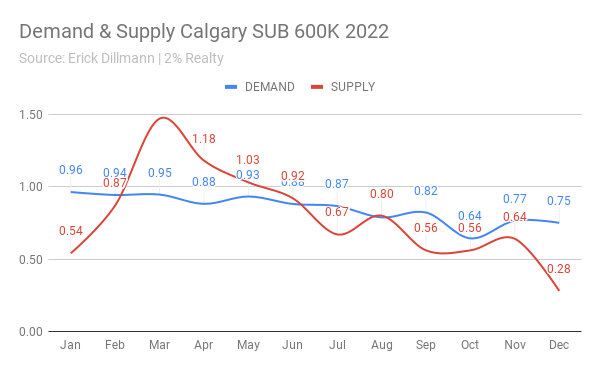
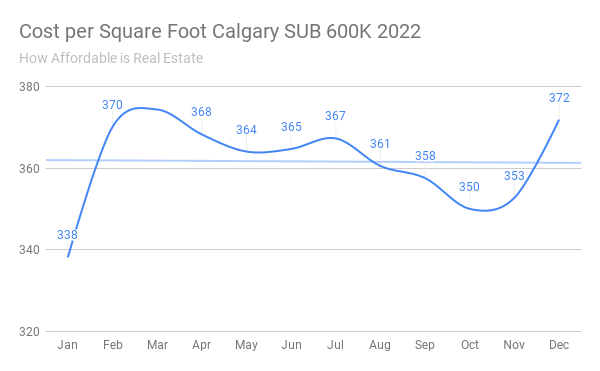
Supply and Demand for SUB 600K Homes
The simplest explanation for falling demand in the 600k+ market is the sudden raise in interest rates in the fourth quarter of the year. A portion of this demand has moved into the SUB 600K segment, keeping demand fairly robust right to the end of the year.
At the end of December 2022, demand was at 0.75 (meaning 3 out of 4 homes sold) while supply dropped to the lowest point on record for the index we track.
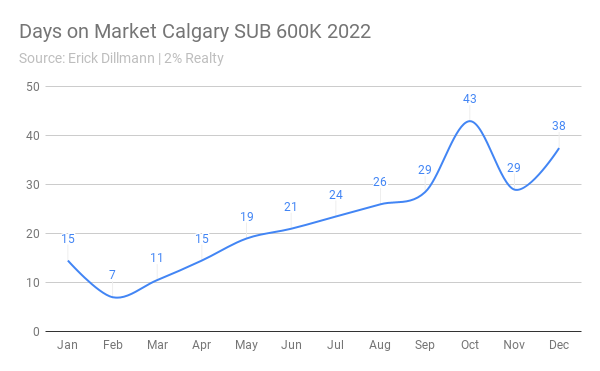
We have seen a steady up trend in days on market, however the monthly read has stayed below that of the 600K+ properties. This is further evidence that home buyers are being pushed into the lower price segment of the market.
Homes listed below 600K became less affordable in 2022, costing $338 per square foot at the start of the year and ending at $372 per square foot. After the initial spike, the cost trended slightly higher and ended 2022 at its highest point.
Considerations
As we enter 2023 we should see a seasonal spike in inventory, however this is unlikely to affect demand for the next few months. With interest rates remaining elevated, the SUB 600K market will remain tight and potentially we could see a return to bidding wars.
A serious concern is that buyers are not correctly pricing the market, and are over paying for “starter home” style properties. This is especially evident in the duplex market, where homes are selling for a historically low discount versus the much larger single family homes.
If we are to see even a mild recession in 2023, this could prove costly for buyers who overpaid in the first half of the year.
Interest Rates
My expectation is that interest rates will remain elevated in 2023, unless there is an economic shock that forces all central banks to lower rates.
Overall the higher interest rate environment will hurt the 600k+ homes more, especially as fixed rate mortgages come due for renewal. Higher rates will also force buyers into SUB 600k homes, potentially making them overvalued.
Interprovincial Migration
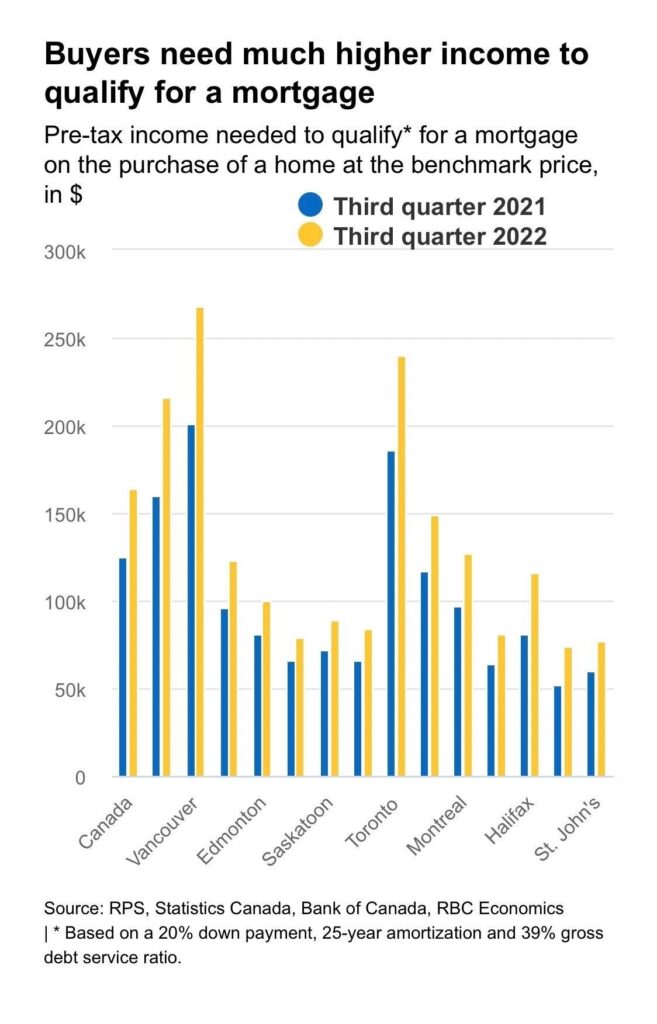
Affordability continues to be the main driving force behind Canada’s intra-provincial migration patterns. The latest data shows a frightening disparity between the income required to purchase a home in Vancouver and Toronto versus other parts of Canada.
This trend in affordability driven migration is expected to continue so long as real estate markets in Ontario and British Columbia remain expensive. As higher interest rates begin to filter into mortgage renewals, it is likely these markets will cool. Often this can cause a sudden spike in migration as people flee while they can still get their money out.
I see no impact from Canada’s recent ban on foreign buyers, as this is purely a political move and will not cause any significant impact to the real estate market, or migration trends.
Inflation
Commodity Pricing
See What We Can Do For You
*Based on 2022 sales performance for Holly & Erick Home Team. Commission savings based on 2% vs 7%/3% fee structure for Calgary & area market.
Request FREE Home Evaluation
